Book reading Gantt charts with Mermaid and Obsidian
How to create a Reading Gantt chart with Obsidian and Mermaid
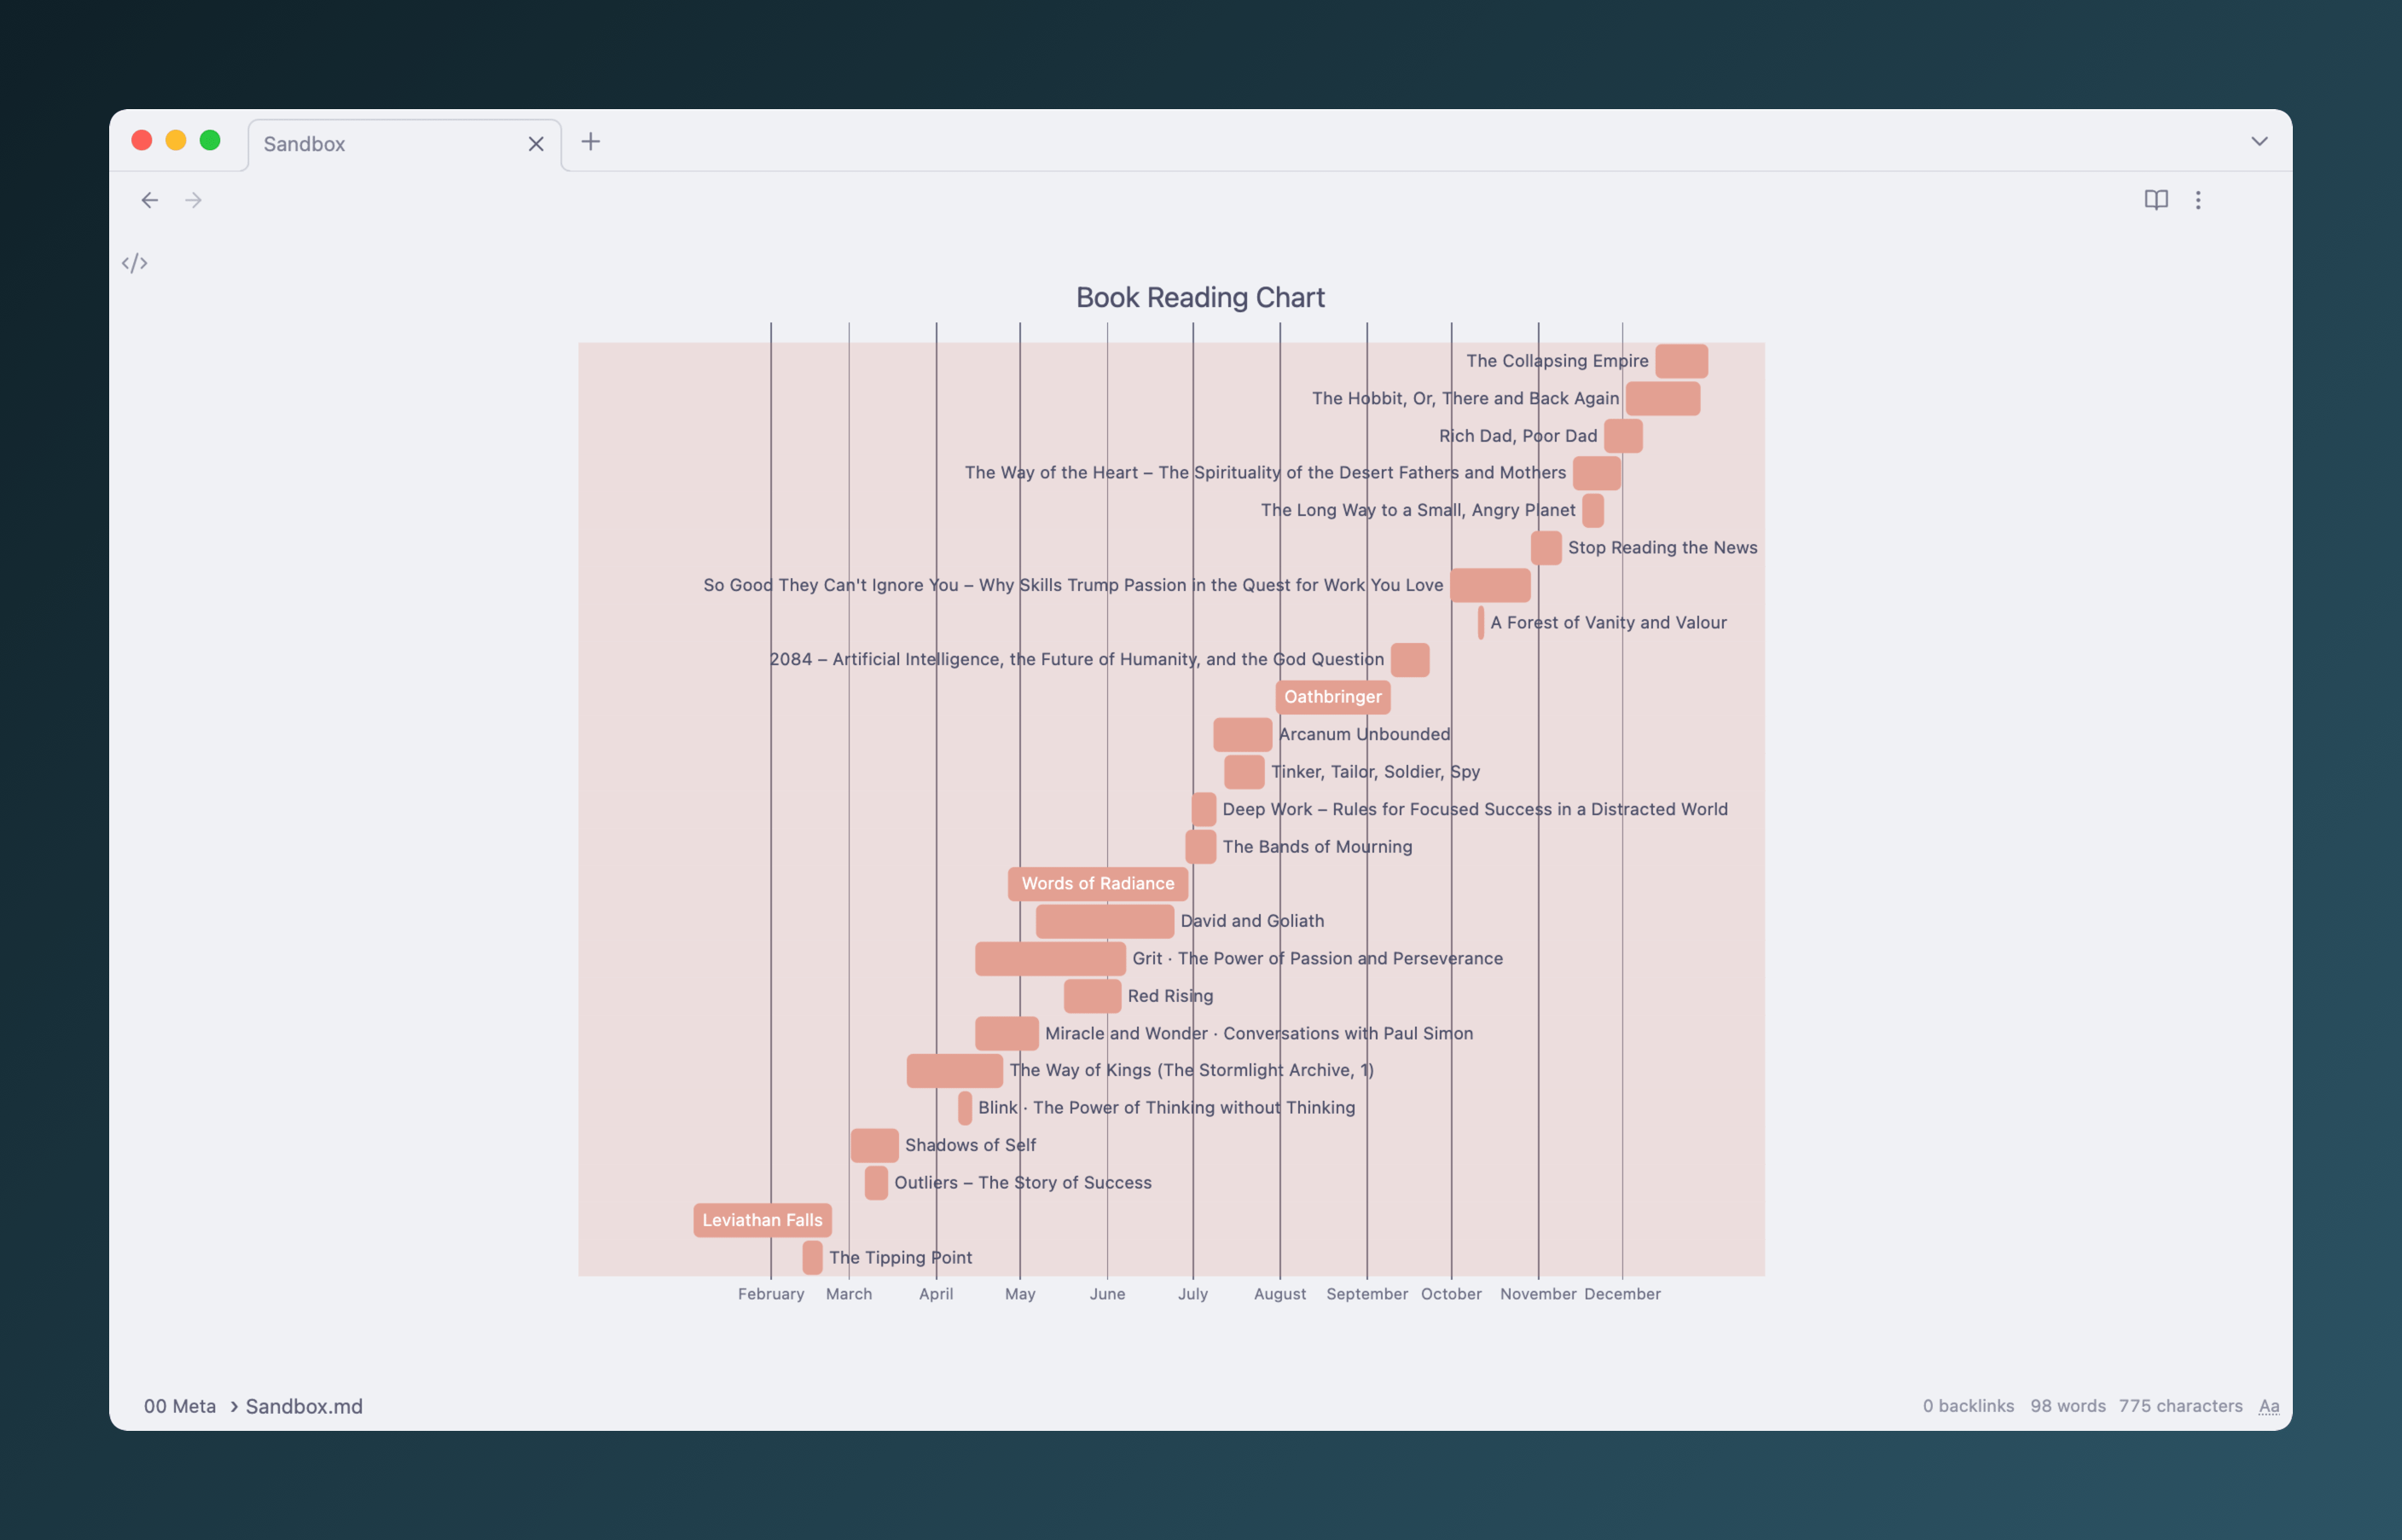
In my Books of 2022 blog post, I shared a chart which gives an overview of my reading throughout the past year:

In this post, I’ll walk you through how you can create a chart like this in minutes!
These charts are generated by Mermaid which uses a simple syntax similar to Markdown. It’s accessible directly in Obsidian, but also has an online live editor.
We'll have a look at two approaches to create an overview Gantt chart:
- Dynamically within Obsidian: Your chart updates automatically.
- Statically, with the Mermaid Live Editor: You have more options for tweaking the chart and can export is as an image.
Requirements
You need to have the Dataview plugin installed for this to work. Each of your book notes should have a started and an added field. Both dates should be formatted in a dataview compatible notation, which is simply YYYY-MM-DD (e.g. 2023-10-31). This is what a book note could look like:
---
started: 2022-10-01
read: 2022-10-29
---

# Book title
Or, if you go with inline fields (my preferred approach):
# Book title

[started:: 2022-10-01]
[read:: 2022-10-29]
Dynamic Chart
This approach uses DataviewJS under the hood, which you might need to enable in the Dataview plugin settings. If you’re not familiar with JavaScript, the code might look a bit intimidating. But don’t fret, you only need to tweak a few things, and it works right out of the box!
- Copy and paste the below code into an Obsidian note. Delete the
//at the start and the end of the code block to create a DataviewJS block. - Tweak the query: If you look at the code, you might notice that the text stored in
promptlooks familiar. This is a plain Dataview query. You can see in theFROMfield that we pull in all notes with the tag#book. Your tag or folder for books is likely different, so you might need to change that in the code. There is more info on theFROMfield in the Dataview Documentation. - Further customisation: To display a chart from another year, you can change the variable
targetYear. It looks a bit funky if changed to the current year, but still works. If you edit themermaidConfvariable, you can also change the behaviour of the chart. You can read about the options in the Mermaid Documentation.
//```dataviewjs

const targetYear = 2022; // For which year do you want to generate a chart?

// Below is the Dataview query. You might need to change the "FROM" field depending on your vault structure
const prompt = `LIST WITHOUT ID
file.name + " :" +
started.day + "-" + started.month + "-" + started.year +
", " +
read.day + "-" + read.month + "-" + read.year
FROM #book
WHERE date(read).year = ${targetYear}
SORT read desc `;

// This is the Mermaid configuration.
const mermaidConf = `mermaid
gantt
    title Book Reading Chart
    dateFormat  D-M-YYYY
    axisFormat  %B
    todaymarker off`;

const te = await dv.queryMarkdown(prompt);
const prefixedList = te.value;
const list = prefixedList.replaceAll(/^-\s/gm, ""); // Dataview prefixes each list item with a hyphen. That would break Mermaid's render, so we remove it.
const backticks = "```";

dv.paragraph(
  `${backticks}${mermaidConf}
${list}
${backticks}
`,
);

//```
If all went to plan, there should be a pretty, automatically updating Gantt chart sitting in your notes.
Static chart
This approach might be even a bit more straightforward than the dynamic chart.
- Paste the below query into any note, surrounded by a dataview query block. Change the
FROMandWHEREfields depending on your vault structure and target year.
LIST WITHOUT ID
file.name + " :" +
started.day + "-" + started.month + "-" + started.year +
", " +
read.day + "-" + read.month + "-" + read.year
FROM #book
WHERE date(read).year = 2022
SORT read desc
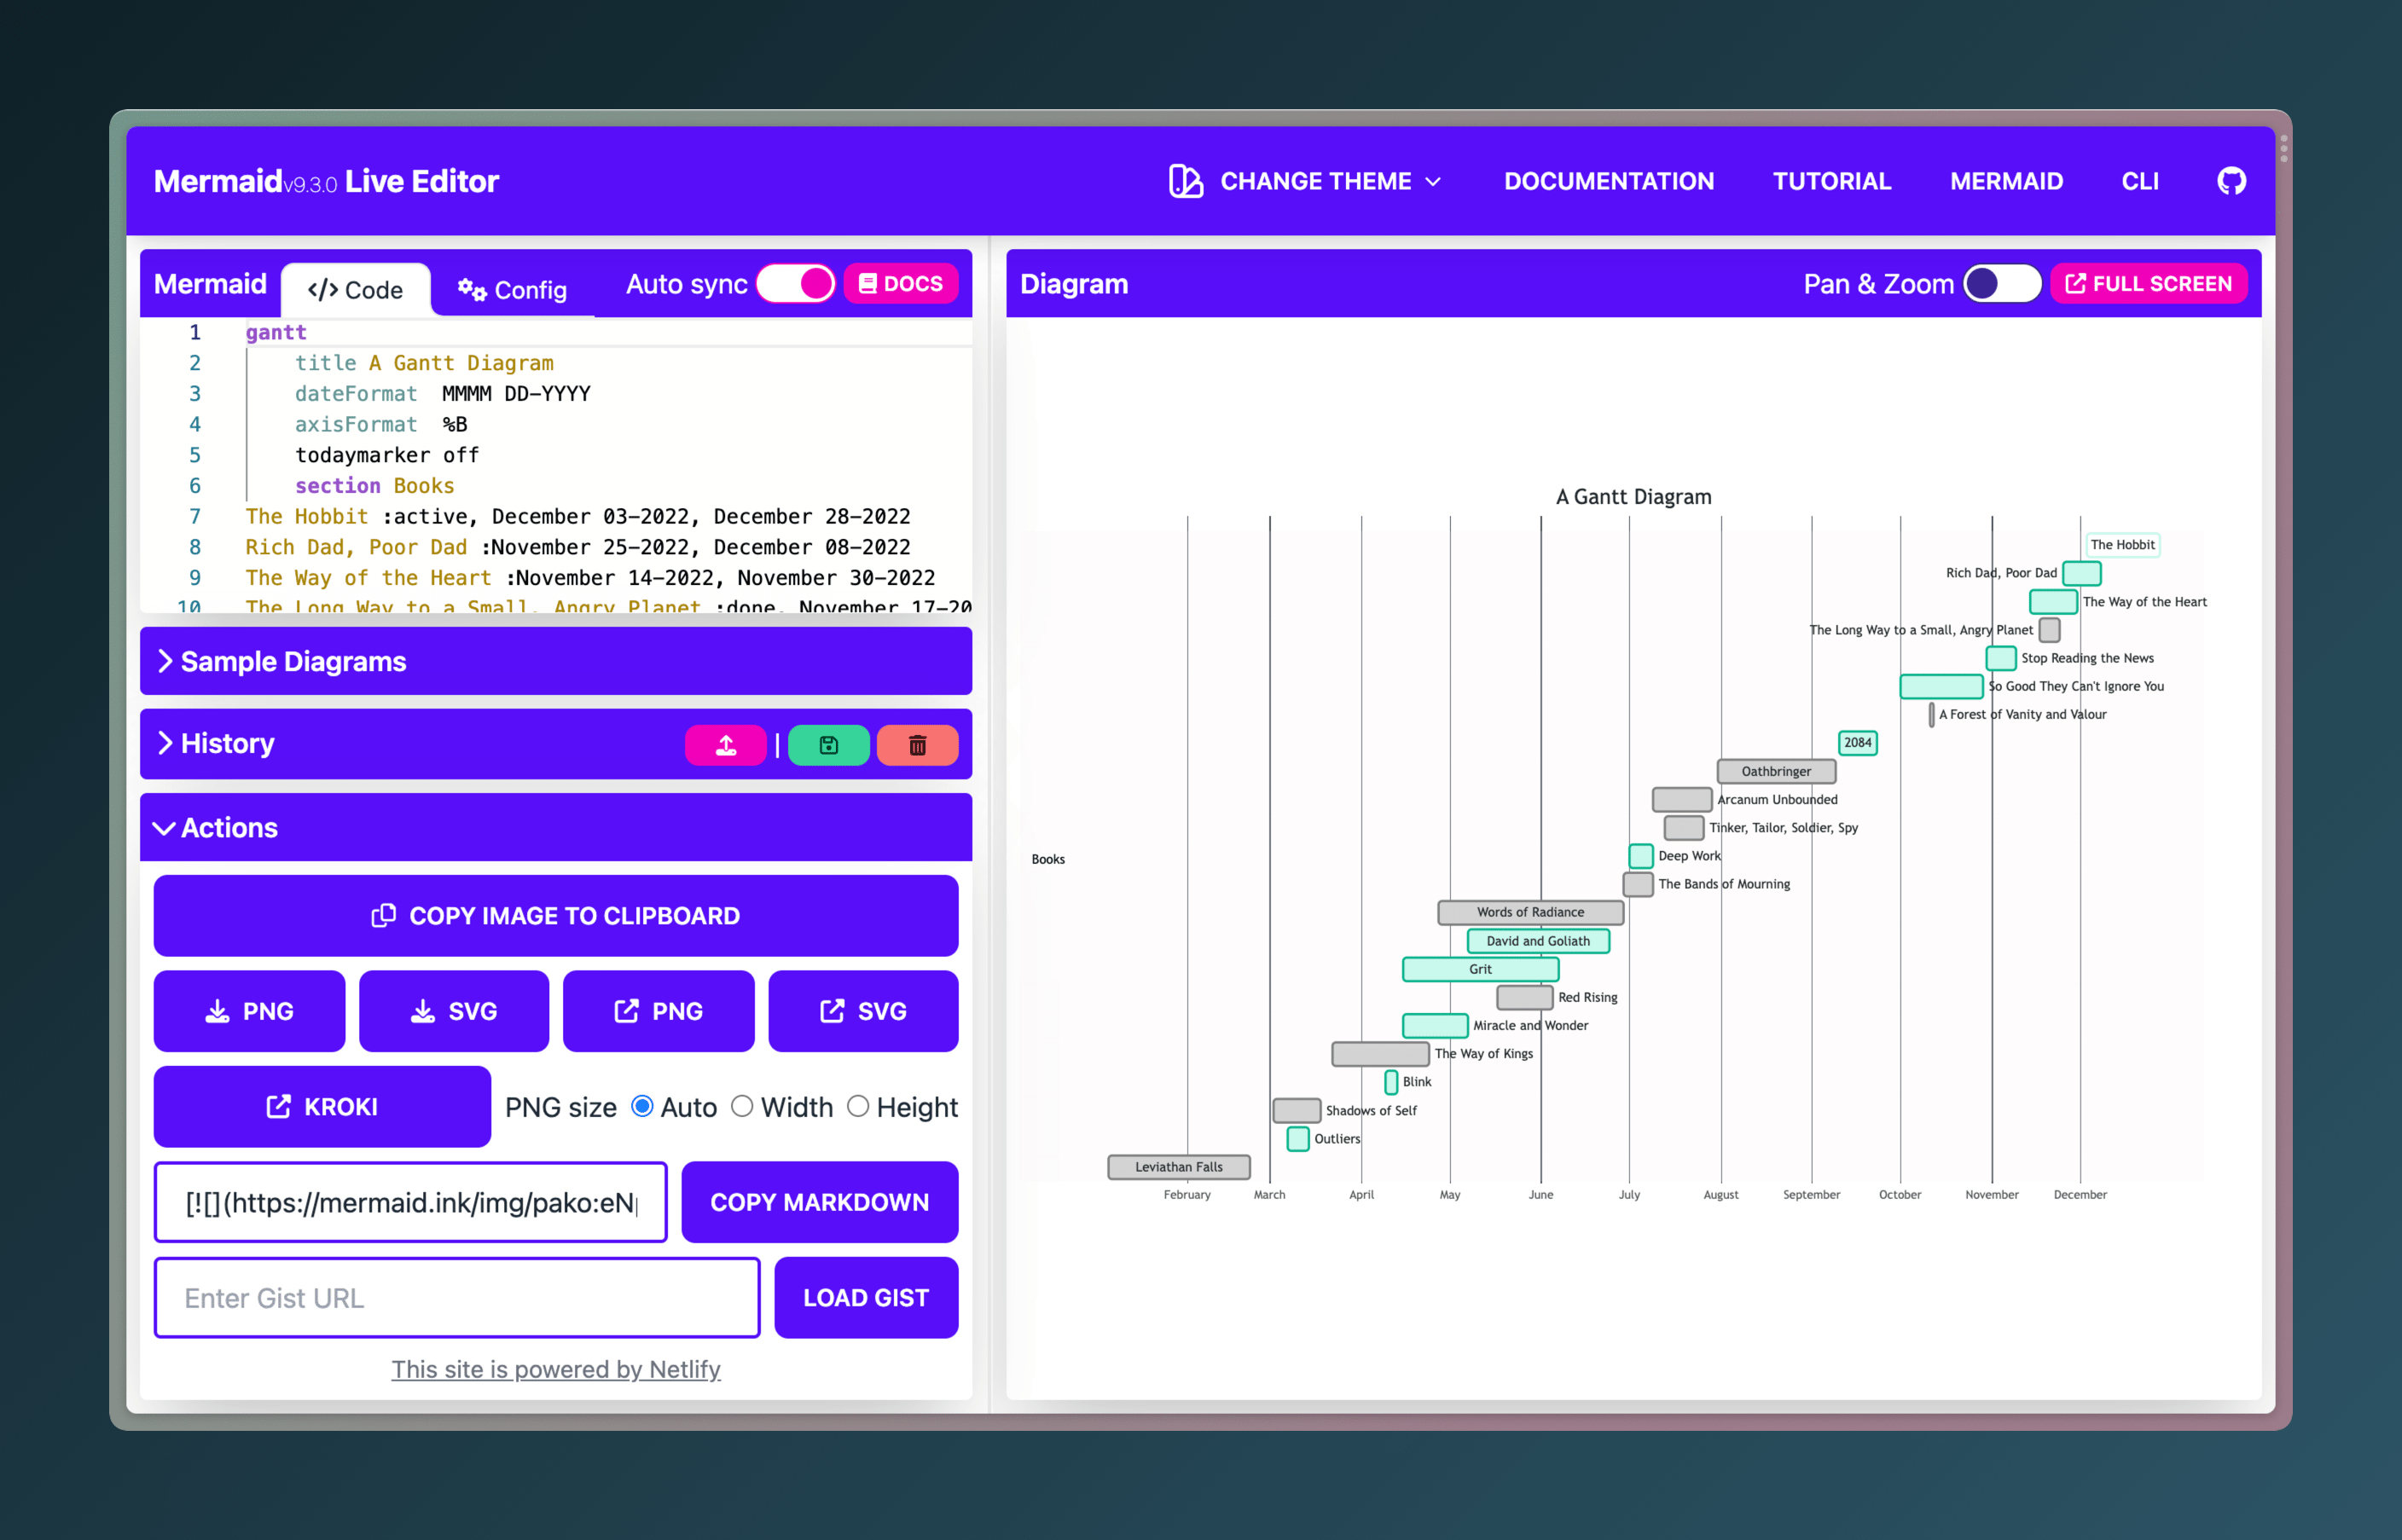
- Open the Mermaid live editor and select the Gantt Sample Diagram. Replace the top configuration section with this:
gantt
  title Book Reading Chart
  dateFormat D-M-YYYY
  axisFormat %B
  todaymarker off
- Copy the output of your dataview query and paste it into the live editor. That should have done the trick! You can export the chart as an image, or paste the code into Obsidian. There are also several options to customise it. I manually added a
donefield to each non-fiction book to distinguish them visually, and shortened some of the titles.
Happy charting!
I hope these approaches worked for you. If you got stuck somewhere, feel free to reach out and I will try to help you make it work.